
In this post, we explore Placer.ai, a location intelligence platform that uses mobile analytics to provide detailed insights into visitor trends
Dataset name: Placer.ai
Placer.ai is a location intelligence platform that analyzes anonymized mobile device data to measure how people move through and interact with physical places. It tracks visitor volume, demographics, and previous locations, making it a valuable resource for understanding how and when people visit destinations. Researchers, communities, businesses, and tourism professionals can use Placer.ai to monitor seasonal trends, compare year-over-year changes, or identify where visitors to local attractions are coming from—insights that can help inform planning, marketing, and investment decisions.
To demonstrate Placer.ai’s capabilities, we used the software to examine visitor trends to the popular skiing destination Spirit Mountain, located in Duluth, Minnesota.
Despite being primarily known as a destination for skiing and snowboarding in the winter, Spirit Mountain sees a sizable number of visitors in warmer months as well. The summer and fall are prime seasons for camping and mountain biking at the recreation area. In recent years, over one third of all visits to Spirit Mountain took place from April to September.
Using Placer.ai, we gathered data about visitor volume by month at Spirit Mountain from 2022-2025. Figure 1 below shows the four-year total of the months of the year with the highest number of visitors.
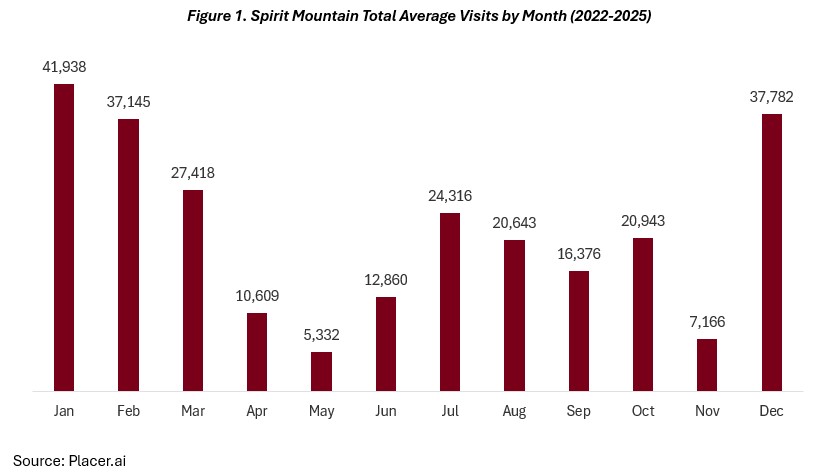
As shown in the graph, the peak winter months with the best skiing and snowboarding conditions draw the largest number of total visits. January has more visits than any other month with an average of nearly 42,000. With the snow mostly gone by May, the ski slopes often close for the season, leading to a sharp decline in visitor volume at Spirit Mountain with just 5,000 visits in that month. However, once temperatures climb and trails firm up, total visits start to increase in June as the camping and mountain biking seasons kick off. In November, warm weather activities come to an end, and there typically still isn’t enough snow for skiing, leading to another low point in terms of total visits.
Looking more closely at a specific season with Placer.ai, we can see how visitor volumes are changing over time and identify potential causes. The past three winters in Duluth have seen drastically different snowfall totals, so it’s reasonable to assume this may be impacting the number of winter visitors to Spirit Mountain’s ski areas. Figure 2 below shows this in more detail.
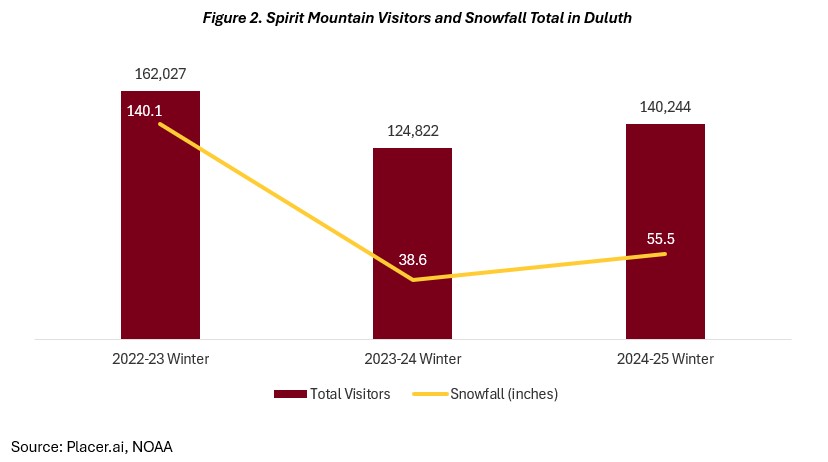
As seen in the graph, with the record setting snowfall total of the 2022-2023 winter, Spirit Mountain saw over 162,000 total visits in the months of December through March. The following winter, Duluth had just under 40 inches of snow, resulting in 37,000 fewer total visits to the recreation area than the previous year. With a closer to average snowfall total last winter, Spirit Mountain saw an uptick in total visits but was still well below the 2022-2023 season’s count.
Beyond seasonal and year-to-year trends, Placer.ai can also show where visitors come from. For example, between October 2024 and September 2025, about 85% of all visits to Spirit Mountain came from within Minnesota, and roughly half of those (43%) were from people located in Duluth. However, when we look instead at unique visitors—that is, counting each person only once regardless of how many times they visited—the picture changes. About 80% of unique visitors were from Minnesota, and only 20% were from Duluth. This suggests that while Duluth residents tend to visit Spirit Mountain repeatedly, many individual visitors come from outside the city.
Despite the impressive capabilities of this location intelligence platform, there are some notable drawbacks to keep in mind. Placer.ai relies on algorithms to estimate visitor volumes based on available mobile analytics data. Events where a large portion of visitors don’t have phones with them can lead to more inaccurate estimates of visitor counts and behaviors. Additionally, location data within Placer.ai is intentionally imprecise to protect individual privacy, which can lead to inaccuracies—especially when analyzing very small or irregularly shaped areas.
This analysis highlights just a handful of the ways Placer.ai can be used to explore visitor trends at a business or location of interest. The platform offers powerful insights into how people move through and interact with places—information that can help communities, organizations, and researchers make data-driven decisions.
The BBER’s access to Placer.ai is made possible through our partnership with the University of Minnesota Extension’s Community Development team, which supports collaborative research across the state. Tools like this help us better understand the economic and recreational patterns that shape northeastern Minnesota.