Continuing our Get to Know a Dataset series, we at the Bureau of Business and Economic Research (BBER) are highlighting this interesting dataset from the United States Bureau of Labor Statistics—The Employment and Wages Data Viewer (EWDV).
The statistics included can provide policymakers, businesses, and even jobseekers with knowledge on historical employment and wage behavior for different geographical regions, industries, or other research queries.
Dataset name: Employment and Wages Data Viewer
What does it measure?
The statistics in the EWDV can be broken down and viewed in many different ways, such as by specific industry ownership groups (private, federal government, state government, etc.) or years and quarters within those years. You can also use the tool to segment industries by geography, North American Industry Classification System (NAICS), and employees per establishment. The final output allows you to see employment, wages, total establishments, and location quotients.
Some interesting findings:
- During the second quarter of 2022, which is the most recent data for all industry sectors in the EWDV, 4.5% of all establishments in the Duluth MSA were listed as being within the manufacturing industry. This placed manufacturing as the eighth largest industry in the Duluth MSA. For comparison, the ninth largest industry, real estate and rentals, follows closely behind at 3.8%.
- The most recent annual data available comes from 2021, and this data showed the manufacturing industry represented 8.4% of the average annual employee workforce in the 2021 Duluth MSA. Therefore, manufacturing was the fourth largest employer, behind healthcare at 28.4%, retail trade at 15.0%, and accommodation & food services at 11.9%.
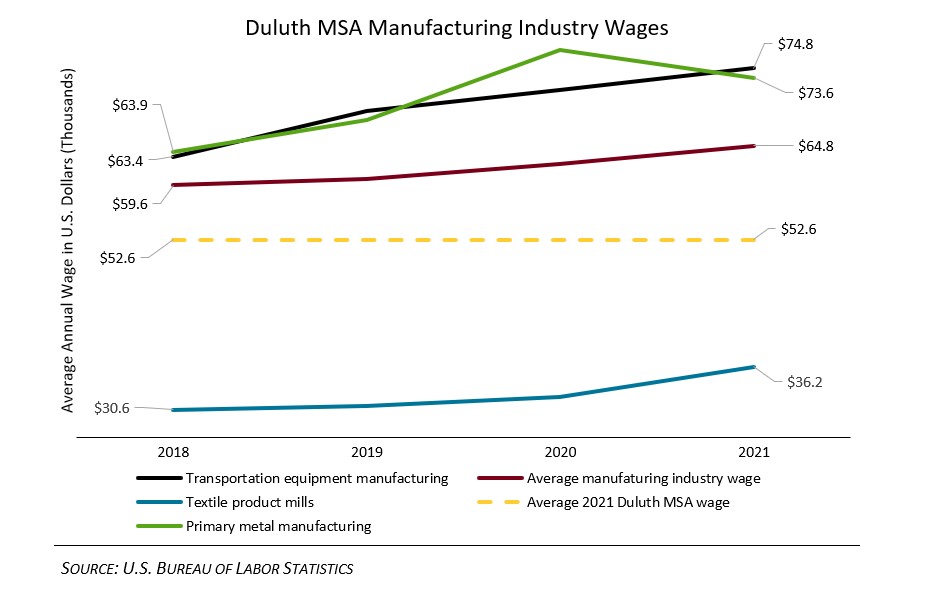
To highlight one use of the database, we examined wage growth in one industry (manufacturing) for one region (Duluth MSA).
The figure below shows the average annual wages of three manufacturing industry sub-sectors in Duluth’s MSA and the average wage of manufacturing as a whole. For comparison, the average 2021 wage for all industries in the Duluth MSA is also displayed.
As shown in the findings, the manufacturing sub-sector industries of primary metal manufacturing and transportation equipment manufacturing’s wages were higher than both the average manufacturing industry wage and the average 2021 Duluth MSA wage over the four-year period assessed. Examples of primary metal manufacturing firms in the area include Me Elecmetal and ArcelorMittal, which has iron ore operations on the Iron Range. Transportation equipment is represented by companies like Cirrus Design Corp. and Fraser Shipyards Inc.
The last sub-sector, and the one paying lower than the industry and MSA averages, is textile product mills. While they have historically paid lower than MSA average, they have shown consistent wage growth since 2018, relative to the average wage for the MSA.
In the end, the wages of the Duluth MSA manufacturing industry as a whole have been growing since 2018, and these average wages have led the Duluth MSA wage average as of 2021.
Specific measures included in the dataset:
- Establishment count (quarterly and annually)
- Employment count (monthly and annual average)
- Total wages (quarterly and annually)
- Average weekly wages (quarterly and annually)
- Average annual wages
- The employment location quotient (ELQ) (quarterly and annually)
- Total wages location quotient (quarterly and annually)

