Lately, rising prices are on everyone’s minds. In April 2022, the inflation rate for the United States was 8.3%, slightly lower than the previous month but still near historic highs, according to U.S. Labor Department data.
Media has reported about this inflation spike—which began in January 2021—with countless stories about its impact on consumers, historical trends, causes and solutions, and what it means for businesses.
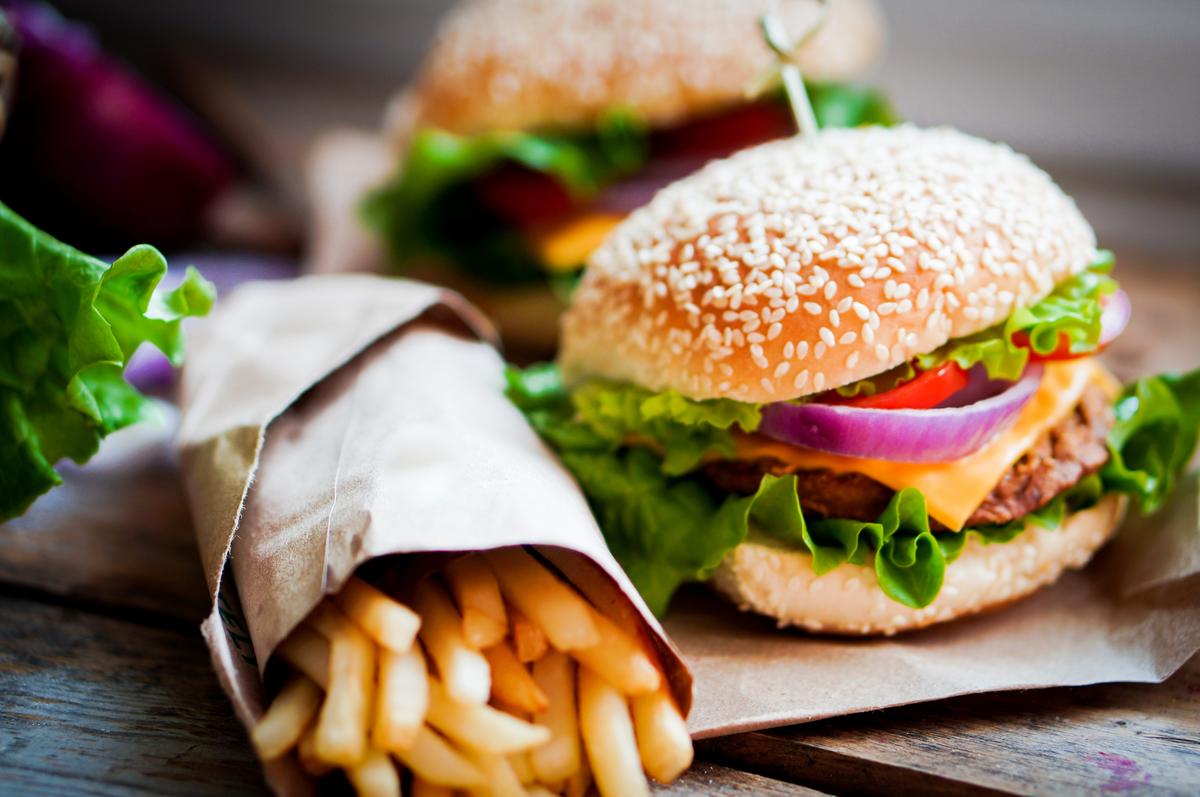
We thought we’d look at local inflation from a much different angle—its effect on the price of the American iconic meal of a cheeseburger and French fries.
Inspired by Greta Kaul’s MinnPost analysis of prices of pizzerias in the Twin Cities, we at the BBER calculated what we’re calling the “Cheeseburger Price Index”—a measure of the average change over time in the prices paid by Duluth consumers for a cheeseburger and French fries.
We chose six Duluth restaurants: 7 West Taphouse, The King of Creams, Bulldog Pizza & Grill, Pickwick Restaurant & Pub, Black Woods Grill & Bar, and The Other Place Bar and Grill. Then, we gathered data on the price of a cheeseburger and fries from these restaurants from 2018 to 2022 using the Wayback Machine, an internet archive website that has saved more than 682 billion web pages since 2014.
Figure 1 below shows the results of the average price increase of this ever-popular meal over five years.
Since 2018, the average burger price for the six restaurants increased by 24%, from about $9.50 to $11.80 in 2022. Notably, the largest price jump occurred in 2019, where the average price increased by 10%, from about $9.50 to $10.50. This big jump in price could be because in October 2019 Duluth enacted a 0.5% increase in the “City Tax” sales tax collected on all dining establishments. Presumably, many Duluth restaurants increased prices either in anticipation of the tax increase or shortly afterward to pass some of the tax cost to customers.
Since the burger price jump in 2019, the average price of a cheeseburger and fries has remained fairly consistent. From 2019 to 2020, the average cheeseburger meal price went up by 2%; from 2020 to 2021, the average price went up by 3%; and in the past year, Duluth’s cheeseburger meal price has increased by 6%. While 6% may still feel like a significant increase to the average consumer, it is notable that the increase in the average price of a Duluth cheeseburger meal between 2021 and 2022 was lower than that of the national Consumer Price Index (CPI)[1] and lower than the increase that the Bureau of Labor Statistics (BLS) calculated for “full-service meals and snacks” (8.7% in April 2022).
Figure 2 compares the percentage increase in the Cheeseburger Price Index (maroon) with the CPI (gold). Both indices are benchmarked on 2018 values.
In 2019, the average burger price increased significantly more than the CPI, but in the following years, the two followed a similar upward trend. Due to the Duluth’s sales tax increase in 2019, city residents have experienced higher inflation than the rest of the U.S. Since 2018, the U.S. CPI has increased by 15%, whereas Duluth cheeseburger and fries prices have increased by 24%.
So what can consumers expect in the coming months and years in terms of inflation? Will the price increases we are currently seeing continue? What is the Federal Reserve doing to try to reduce inflation nationally? And how will that affect our cheeseburgers and fries?
According to a webinar by the Federal Reserve Bank of Minneapolis called “Conversations with the Fed: Inflation 101,” held on March 31, there are a number of factors that are driving the increased inflation we are experiencing right now. First, the COVID-19 pandemic caused a substitution in the way people spent their money. Purchases of services went way down, while purchases of goods accelerated very rapidly and have remained high. Historically, goods prices tend to be very stable, relative to services, but this unexpected jump in demand for goods caused massive supply chain issues and, as a result, higher prices.
According to the Fed’s webinar, much of the initial jump in inflation (mid-2021) was related to increases in the price of vehicles and a rebound effect in pandemic-affected services. Even now, the largest price increases have been in used cars and trucks, gasoline, energy, and electricity. Much of those increases have been related to supply chain difficulties, such as a lack of semiconductors.
What is the Fed doing in response? If you’ve been watching the news, you probably know that it has started raising interest rates. Just last week, it announced a 0.5% increase in interest rates, the largest increase since 2000. Markets are expecting dramatic increases in rates for the coming year. According to the Fed’s webinar, market and professional forecasters continue to be confident that long-term inflation will return to 2%.
With the latest inflation rate still hovering near 8%, let’s just hope the forecasters are right. After more than a year of heightened inflation, we’re craving for some stability in the price of a cheeseburger and fries.
[1] The CPI, calculated monthly by the Bureau of Labor Statistics, is the most widely used measure of the average change over time in prices paid by consumers. The BLS calculates the CPI by gathering household goods and services, determine a weighted average that includes food, clothing, housing, and other household spending.
