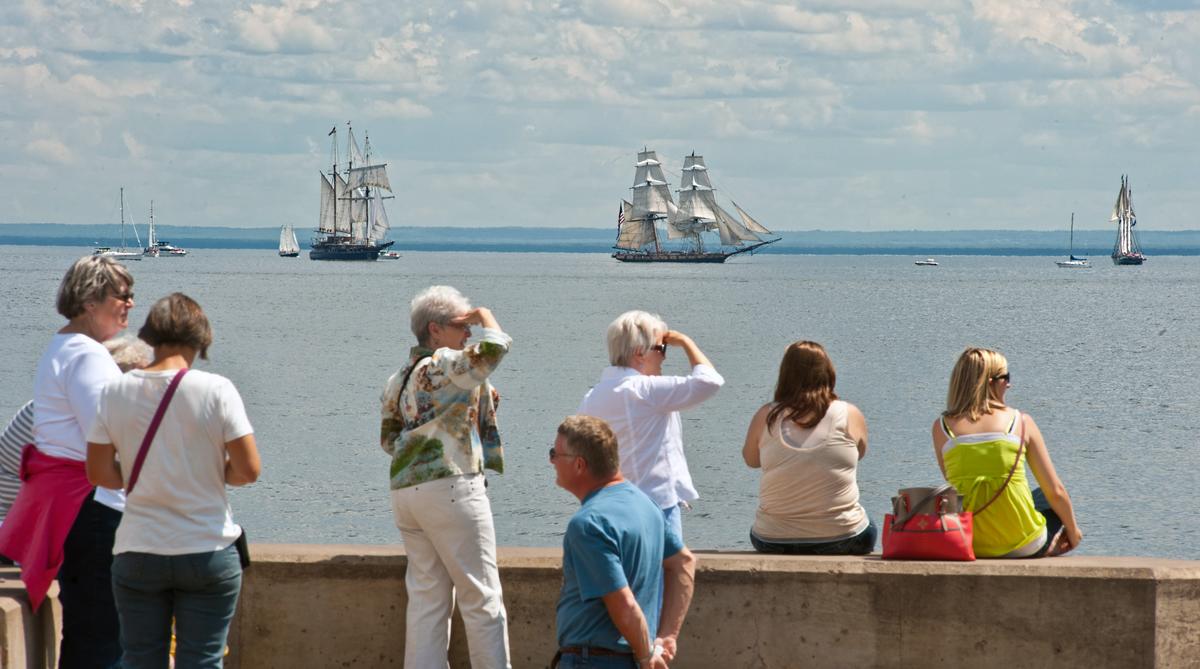
In early 2020, the Bureau of Business and Economic Research (BBER), was asked to study and estimate the economic impact of the tourism industry in Duluth. The study area used in the analysis includes all Duluth zip codes.
The research objectives of this study included the following:
- Show size of Duluth’s tourism industry in terms of employment and value added.
- Show recent trends in employment for the tourism industry.
- Model economic impacts of 0.5%, 2%, and 4% increases in the Duluth tourism industry.
Figure 1 shows employment in the leisure and hospitality industry, as measured by the Quarterly Census of Employment and Wages (QCEW). As shown in the figure, employment grew from roughly 6,770 in 2011 to 7,200 in 2019. Of course, 2020 experienced a steep decline in employment, due to the COVID-19 pandemic. Annual employment in the leisure and hospitality industry was roughly 5,300, significantly lower than any other year in recent history. While it may take the industry some time to fully recover from the steep decline in 2020, we chose not to include the most recent year in this analysis, as we are assuming the industry will recover.
Using employment data from the QCEW, the research team evaluated recent trends in employment growth to determine realistic growth rates to use in modeling. For example, between 2011 and 2019 employment in the tourism industry grew by roughly 6.0% (0.75% annualized). In the three years from 2016 to 2019, employment grew by roughly 5.7% (1.9% annualized). During the eight-year period from 2011 to 2019, the highest one-year growth rate (3.7%) occurred between 2016 and 2017. Therefore, the research team assumed growth rates of 0.5%, 2%, and 4% as conservative, moderate, and best-case scenarios, respectively.
Economic impact analysis tracks an initial economic shock or activity (like direct spending from tourists) through multiple rounds of industry and consumer spending to show the multiplier or ripple effects through a local economy. The initial shock or activity is considered the direct effect, the resulting increase in industry spending is the indirect effect, and the resulting increase in consumer spending is the induced effect. This section summarizes the economic impacts for each of the scenarios, using employment in 21 IMPLAN industries related to tourism as a baseline.
This section provides the positive economic impacts for three scenarios: 0.5%, 2%, and 4% growth in the size of the tourism industry in Duluth, Minnesota. Inversely, the scenarios could also represent 0.5%, 2%, and 4% decreases in the size of tourism industry, and the values could be interpreted as negative impacts. Results, shown in Table 1, represent impacts for the city of Duluth and are shown in 2020 dollars. Results are measured in employment, output, labor income, and value added.
The column labeled employment shows the number of jobs that the tourism industry could create both directly and through indirect and induced effects. Depending on the scenario, the tourism industry could see anywhere from 78 to 627 new jobs if the industry grew from 2019 levels.
The column labeled labor income is the total of all employee compensation. This includes wages, benefits, and payroll taxes for full- and part-time workers. Under Scenario 1 (0.5% growth from 2019 levels), the city could see $2.4 million in new labor income. Under the most aggressive scenario, the city could see more than $19 million in new labor income.
The column labeled value added refers to the contribution to the GDP made by an individual producer, industry, or sector. In this case, it’s the tourism industry. Value added includes employee compensation, proprietor income, and other property income and taxes. If the city were to grow its tourism industry by 4%, over 2019 levels, the city could see nearly $30 million in additional value added spending.
Output, the last column in the table, is the total value of all local production required to sustain activities. A 0.5% increase would generate $7.0 million in output citywide, whereas a 4% increase would add $55.7 million in additional output to the city’s economy.
The multipliers shown in the last row of the table represent the size of the “ripple effect” felt throughout the rest of the economy. For example, the employment multiplier for the tourism industry is 1.28, meaning that for every 1 job added in that industry there will be 0.28 jobs added in other industries.
