Carson Gorecki, the Minnesota Department of Employment and Economic Development’s (DEED) labor market analyst for Minnesota’s northeast region, recently visited BBER Director Monica Haynes’ Labor Economics class at the Labovitz School of Business and Economics to talk about common metrics and data sources for use in research.
As part of his presentation, Gorecki shared an interesting chart that he had created using location quotients to show the industries that were more concentrated in the northeast region (the Arrowhead Region’s seven counties of Aitkin, Carlton, Cook, Itasca, Koochiching, Lake, and St. Louis) compared to the state and which industries had seen growth in employment over the past decade. Haynes, who was so impressed with the chart, recreated it using the recently released data from the Quarterly Census of Employment and Wages (QCEW).
A location quotient is a measure of an industry’s concentration or strength in a local area, compared with a larger region. In the simplest terms, a location quotient is a ratio of the percentage employment in an industry in the region of interest, divided by the percentage employment in the same industry in the larger area. In this scenario we are comparing employment by industry in the northeast region with that of the state overall.
This post highlights two examples of how analysts can use location quotients to determine the strengths, weaknesses, opportunities, and threats of a specific region. The first is a visual example, using a bubble chart, but for a small number of industries. The second example provides a more in-depth look at a wider range of industries. Both are valuable tools to better understand a region’s economy.
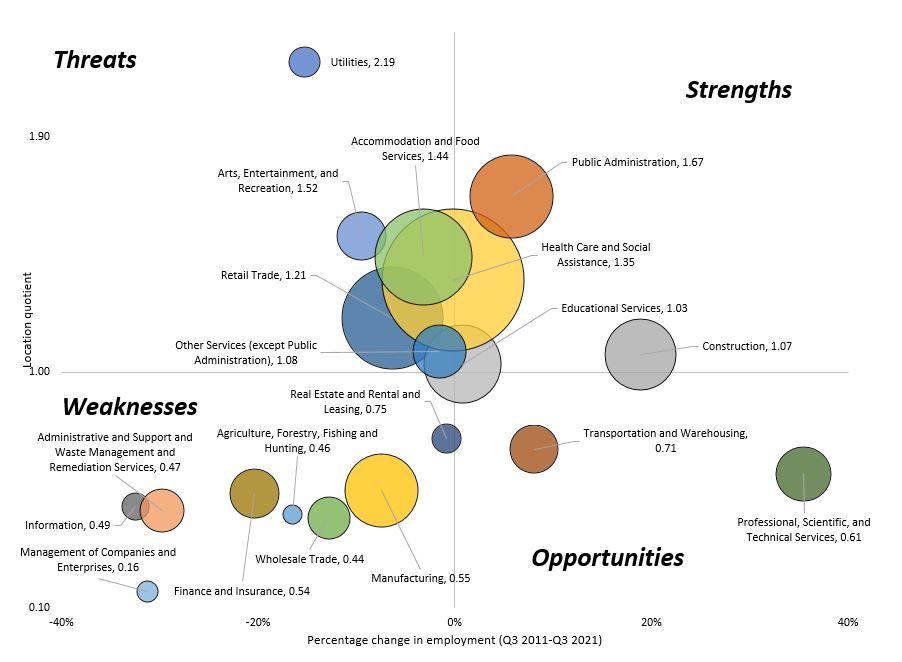
Figure 1 shows 19 of the top 20 industries in northeast Minnesota. The X-axis (left to right) shows the percentage change in employment from the third quarter (Q3) of 2011 to Q3 of 2021. Industries further to the left have lost a larger share of jobs over the ten-year period, while industries further to the right have gained employment. The Y-axis (top to bottom) shows the location quotient for each industry, with a value of 1 suggesting the industry has the same share of employment locally as it does statewide, and higher location quotients suggesting industries with a higher proportion of local employment. Finally, the size of the bubble indicates the number of jobs in that industry locally, with the largest bubbles employing the most jobs.
The mining industry is not shown in the chart as its location quotient is significantly higher than any other industry in the region, with a value of 14.1. This indicates that, compared with the state overall, the concentration of jobs in mining in the northeast region is fourteen times higher than it is statewide. In other words, while 2.9% of jobs in northeast Minnesota are in the mining industry, roughly 0.2% of jobs statewide are in that industry. All other industries have location quotients of less than 2.2, with the utilities industry having the second largest location quotient in the region. That is why utilities is highest in the chart.
While axes show the percentage change and location quotient of each industry, the chart is also in four quadrants. The upper right hand quadrant contains industries that are highly concentrated in the region and have been growing. These can be seen as regional economic strengths. The lower left-hand quadrant industries, on the other hand, employ a smaller share of workers locally than is typical for the industries statewide. Additionally, they are not growing; having shed jobs over the past decade suggests they are weak for the region. The bottom right quadrant includes industries that have lower shares of employment than the state’s level of employment. However, they have been growing in recent years, which suggests that they may be development opportunities for the economy. Finally, the upper-left quadrant includes industries that are highly concentrated but which have seen declines in employment. These could be potential threats to the region’s economy if something is not done to counteract that employment trend.
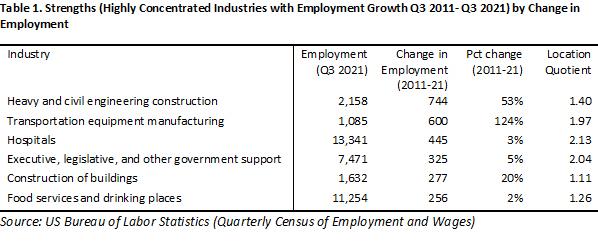
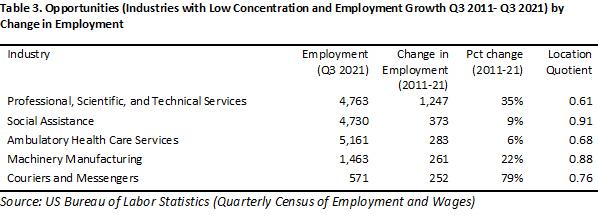
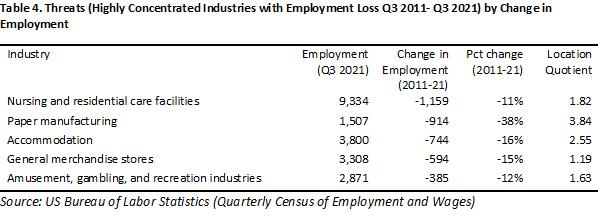
Tables 1 through 4 use a similar technique in determining industries’ strength and concentration, but the tables focus on a detailed set of industries to determine the sub-industries that are driving the trends shown in Figure 1. In this example, we used three-digit NAICS codes[1] rather than two-digit codes. This method yields 84 unique types of industries, rather than 20. Using the initial list of 84, the BBER classified each industry into one of the four groups: strengths (concentrated and growing), weaknesses (not concentrated and declining), opportunities (not concentrated and growing), and threats (concentrated and declining). Within those four groups, we selected the five industries with the greatest change in employment (either positive or negative) from Q3 2011 to 2021. The top five industries in each category are shown in the four tables below.
In looking at the tables, some interesting takeaways emerge. The region’s strongest industries (Table 1) appear to be in construction and transportation, which have had some of the largest job gains over the past ten years. The hospitals and government support industries have also seen sizable gains in employment. Considering that COVID-19 decimated much of the dining and hospitality industries, it is notable that the food services and drinking places industry has actually seen positive growth in employment since 2011.
As for the region’s weaknesses (Table 2), the administrative and support services industry has lost more than 1,200 jobs in the past decade. This industry includes employment services, business support services, and all other support services. Much of those declines are likely due to the impacts of COVID-19, but it warrants further investigation into specifically which jobs have been lost. Other major employment losses have come in insurance, clothing stores, management, and wood products manufacturing.
As for opportunities (Table 3), the professional, scientific, and technical services industry has added a significant number of jobs over the past decade. Most of the gains in this area have come in the scientific research and development, computer systems design, and architectural and engineering industries. This represents a great opportunity for the northeast region, as these tend to be industries with higher wages and more opportunities for growth in general.
Finally, there are a number of potential threats (Table 4) that emerge from our analysis. These are industries that are highly concentrated in our region but which have lost large numbers of jobs over the past decade. These industries include nursing and residential care facilities, paper manufacturing, and accommodation, among others.
These results can help inform policy makers, economic development professionals, and business leaders as they consider how to support our local economy and our industries moving forward.
[1] The North American Industry Classification System (NAICS) is the standard used by federal statistical agencies in classifying business establishments for the purpose of collecting, analyzing, and publishing statistical data related to the U.S. business economy. https://www.census.gov/naics/


