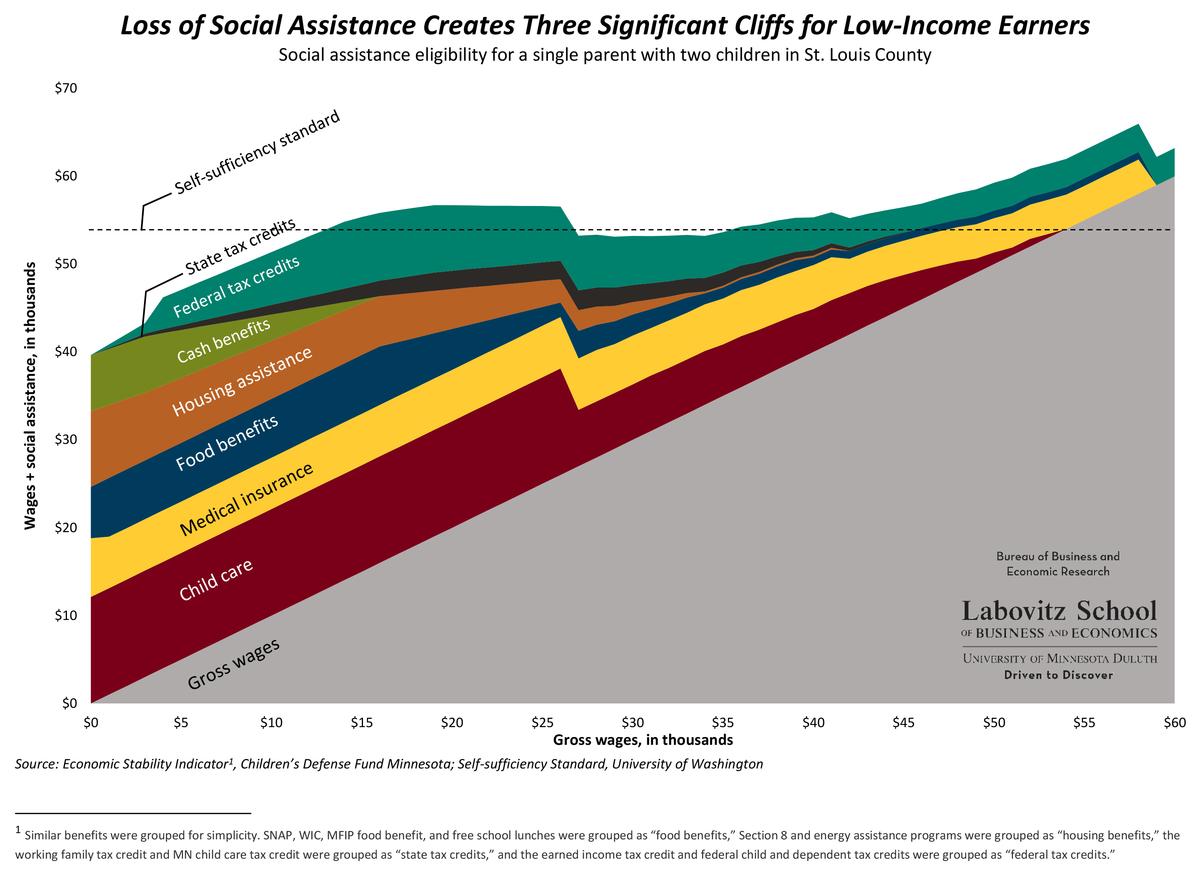
One of the projects that I have had the opportunity to work on was an examination of the inefficiencies in the incentivization social assistance (formally know as welfare). Partnering with the Minnesota Department of Employment and Economic Development (MNDEED), the we at the BBER developed a graphic displaying specific benefits received by income level. In our model, we assumed a single parent with two children in St. Louis County and used calculations of benefits received from the Children’s Defense Fund and the self-sufficiency income level from the University of Washington.

Working on this project provided me with great experience as well as insight to an issue with which I was overall unfamiliar. I am pleased and very proud of the final product we were able to produce. I was challenged over the course of the project in the data gathering, analysis, and especially the formatting. Over the course of the project we changed the product multiple times. Flexibility was key in this to be successful. While formatting the graphic, we paid close attention to data visualization best practices. Tradeoffs are faced between comprehensibility of content and quality of content. Over the course of the project, I was challenged by this and often had to take a step back and critically think about the context of the audience.
By creating the graphic, we were able to clearly identify three levels of disproportionate losses of social assistance regarding a marginal increase of income. The three levels occur at the $26,000, $40,000, and $59,000 income levels. We plotted the combined wages and social assistance against the self-sufficiency standard developed by the University of Washington. The self-sufficiency standard measures the livable wage of a single parent with two children.
The first cliff occurs when a single parent goes from making $26,000 in gross annual wages to $27,000. The $1,000 increase in wages would result in an approximate $5,000 loss in social assistance. Therefore, overall the individual would be worse off by about $4,000. This loss would put the individual below the self-sufficiency line. The first cliff is derived from the loss of childcare. The second cliff occurs when a single parent goes from making $40,000 to $41,000 in gross annual wages. The cliff results in a loss of about $2,000 in social assistance, paired with a $1,000 increase in gross wages the net effect is a loss of $1,000. The second cliff is due to the loss of housing assistance and state tax credits. The third cliff occurs when a single parent goes from making $58,000 to $59,000 in gross annual wages. The cliff results in a loss of about $6,000 in social assistance compared with the $1,000 increase in gross wages, resulting in a net loss of $5,000 that is incurred by the parent. The third cliff is due to the loss of medical insurance and food benefits. Past the third cliff the only remaining social assistance a single parent receives are federal tax credits. BBER's Visuals
The benefits cliff illustrates a disincentive to pursue a promotion or a higher wage in St. Louis County. The source of the benefits cliffs lies not in the lack of motivation of workers but in the inefficient public policy being implemented. In my Labor Theory course at UMD, we discussed and analyzed the implications of benefit reduction rates. A benefit reduction rate is the level at which the social assistance received decreases as gross income increases. A constant benefit reduction rate would result in the proportional depletion of social assistance received as income increases, thus providing incentives for workers to work more hours and to pursue raises and promotions. In the example of St. Louis County, our jagged benefit reduction rate is the source of these economic inefficiencies. A solution to this issue would be restructuring social assistance programs to gradually reduce it as opposed to the jagged cliffs or drop offs.